Prometheus Federation
들어가며
Prometheus는 Federation을 통해 샤딩된 프로메테우스 메트릭을 통합하여, 수평적 확장을 이뤄낼 수 있습니다.
이 문서를 통해 Prometheus Federation에 대해 정리하고, 핸즈온을 진행합니다.
FEDERATION


프로메테우스는 federate configuration을 통해 특정 타임 시리즈 데이터를 다른 프로메테우스 서버로부터 스크랩할 수 있습니다.
Use cases
- Scalable Prometheus Monitoring
- Moving Prometheus Metric
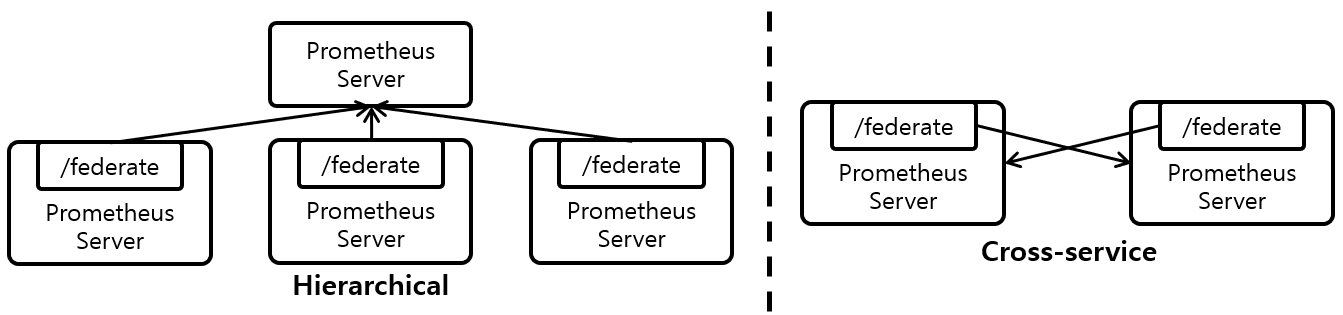

Hierarchical federation
- 프로메테우스를 계층적으로 결합함으로써 수십 개 데이터센터, 수백만 개 노드로 확장 가능
- 트리 형태로, 상위 계층의 프로메테우스 서버는 더 많은 하위 프로메테우스에서 집계한 시계열 데이터 수집
- 예를 들어, 데이터 센터별로 인스턴스 레벨의 상세 데이터를 수집하는 프로메테우스 서버를 따로 두고
- 인스턴스 레벨에서 집계한 데이터(job 레벨로 필터링)만 수집하고 저장하는 프로메테우스 서버 세트 구성 가능
Cross-service federation
- 특정 서비스의 프로메테우스 서버가 다른 서비스의 프로메테우스 서버에서 저장하는 데이터를 스크랩하도록 설정
- 단일 서버 내에서 두 데이터 셋을 이용해 alert을 정의하고 쿼리를 실행할 수 있음
- 예를 들어 여러 서비스를 실행하고 있는 클러스터 스케줄러가, 이 클러스터에서 실행되는 서비스 인스턴스들에 대한 리소스 사용 정보(메모리, CPU 사용량)을 노출
- 반면 클러스터에서 실행되는 서비스는 애플리케이션 메트릭만을 노출
- 이런 두 메트릭 셋은 별도 다른 프로메테우스 서버로 스크랩하는 경우가 많음
- 서비스 레벨 메트릭을 관리하는 프로메테우스 서버가 federation을 이용하여 클러스터 프로메테우스에서 자신의 서비스와 관련된 리소스 사용량 메트릭을 가져올 수 있음
- 결과적으로 서버 내에서 두 메트릭 셋을 다 활용할 수 있게 되는 것
Configuration Federation
프로메테우스의 /federate 엔드포인트를 통해, 해당 서버에서 저장하는 타임시리즈 데이터 현재 값을 조회할 수 있습니다.
- 조회할 타임시리즈를 선택하기 위해선 반드시 URL 파라미터
match[]를 최소 하나는 지정해야 함 - 각
match[]인자에는 up이나{job=“api-server”}같은 instance 벡터 셀렉터를 명시해야 함
Example
scrape_configs:
  - job_name: 'advanced-federation1'
    scrape_interval: 20s
    scrape_timeout: 20s
    scheme: http
    metrics_path: /federate
    honor_labels: true
    metric_relabel_configs:
      - source_labels: [id]
        regex: '^static-agent$'
        action: drop
    params:
      match[]:
        - '{__name__=~"kube_.*"}'
    static_configs:
      - targets: ['child-prometheus1:31090']

  - job_name: 'advanced-federation2'
    scrape_interval: 20s
    scrape_timeout: 20s
    scheme: http
    metrics_path: /federate
    honor_labels: true
    metric_relabel_configs:
      - source_labels: [id]
        regex: '^static-agent$'
        action: drop
    params:
      match[]:
        - '{__name__=~"node_.*|container_.*"}'
    static_configs:
      - targets: ['child-prometheus1:31090']
Prometheus Federation Hands-on
Prometheus Federation을 핸즈온합니다.
3개의 프로메테우스 서버가 MongoDB replicaset 3개 멤버의 메트릭을 각각 scrape하고,Parent 프로메테우스와 Child 프로메테우스 hierarchy를 두어 메트릭을 분산 저장하고,
최종적으로 Parent 프로메테우스에서 메트릭을 통합 조회하는 형태가 되겠습니다.
Prometheus Configuration
프로메테우스 서버를 구성합니다.
Prometheus node 1 (Parent Prometheus)
# my global config
global:
  scrape_interval: 15s # Set the scrape interval to every 15 seconds. Default is every 1 minute.
  evaluation_interval: 15s # Evaluate rules every 15 seconds. The default is every 1 minute.
  # scrape_timeout is set to the global default (10s).

# Alertmanager configuration
alerting:
  alertmanagers:
    - static_configs:
        - targets:
            - alertmanager:9093

# Load rules once and periodically evaluate them according to the global 'evaluation_interval'.
rule_files:
  - "rule.yml"

scrape_configs:
  # The job name is added as a label `job=<job_name>` to any timeseries scraped from this config.
  - job_name: "prometheus"
    static_configs:
      - targets: ["localhost:9090"]

  - job_name: "federation"
    scrape_interval: 15s
    scrape_timeout: 15s
    scheme: http
    metrics_path: /federate
    honor_labels: true
    #params:
    static_configs:
      - targets: ['jude-prom-fede-2:9090', 'jude-prom-fede-3:9090']

  - job_name: "mongo_exporter"
    static_configs:
      - targets: ["jude-mng-repl-1:9216"]

  - job_name: "node_exporter"
    static_configs:
- targets: ["jude-mng-repl-1:9100"]Parent가 될 Prometheus node 1의 prometheus.yml configuration입니다.
- Prometheus node 1은
mng-repl-1의 메트릭만 scrape합니다. scrape_configs:/federate을 통해 지정된 children(targets)의 metric을 federate합니다.
Prometheus node 2 (Child Prometheus)
# my global config
global:
  scrape_interval: 15s # Set the scrape interval to every 15 seconds. Default is every 1 minute.
  evaluation_interval: 15s # Evaluate rules every 15 seconds. The default is every 1 minute.
  # scrape_timeout is set to the global default (10s).

# Alertmanager configuration
alerting:
  alertmanagers:
    - static_configs:
        - targets:
            - alertmanager:9093

# Load rules once and periodically evaluate them according to the global 'evaluation_interval'.
rule_files:
  - "rule.yml"

scrape_configs:
  # The job name is added as a label `job=<job_name>` to any timeseries scraped from this config.
  - job_name: "prometheus"
    static_configs:
      - targets: ["localhost:9090"]

  - job_name: "mongo_exporter"
    static_configs:
      - targets: ["jude-mng-repl-2:9216"]

  - job_name: "node_exporter"
    static_configs:
- targets: ["jude-mng-repl-2:9100"]Child가 될 Prometheus node 2의 prometheus.yml configuration입니다.
- Prometheus node 2은
mng-repl-2의 메트릭만 scrape합니다.
Prometheus node 3 (Child Prometheus)
# my global config
global:
  scrape_interval: 15s # Set the scrape interval to every 15 seconds. Default is every 1 minute.
  evaluation_interval: 15s # Evaluate rules every 15 seconds. The default is every 1 minute.
  # scrape_timeout is set to the global default (10s).

# Alertmanager configuration
alerting:
  alertmanagers:
    - static_configs:
        - targets:
            - alertmanager:9093

# Load rules once and periodically evaluate them according to the global 'evaluation_interval'.
rule_files:
  - "rule.yml"

scrape_configs:
  # The job name is added as a label `job=<job_name>` to any timeseries scraped from this config.
  - job_name: "prometheus"
    static_configs:
      - targets: ["localhost:9090"]

  - job_name: "mongo_exporter"
    static_configs:
      - targets: ["jude-mng-repl-3:9216"]

  - job_name: "node_exporter"
    static_configs:
- targets: ["jude-mng-repl-3:9100"]Child가 될 Prometheus node 2의 prometheus.yml configuration입니다.
- Prometheus node 2은
mng-repl-2의 메트릭만 scrape합니다.
Prometheus 확인
프로메테우스 서버 구성을 확인합니다.
Prometheus node 1 (Parent Prometheus )
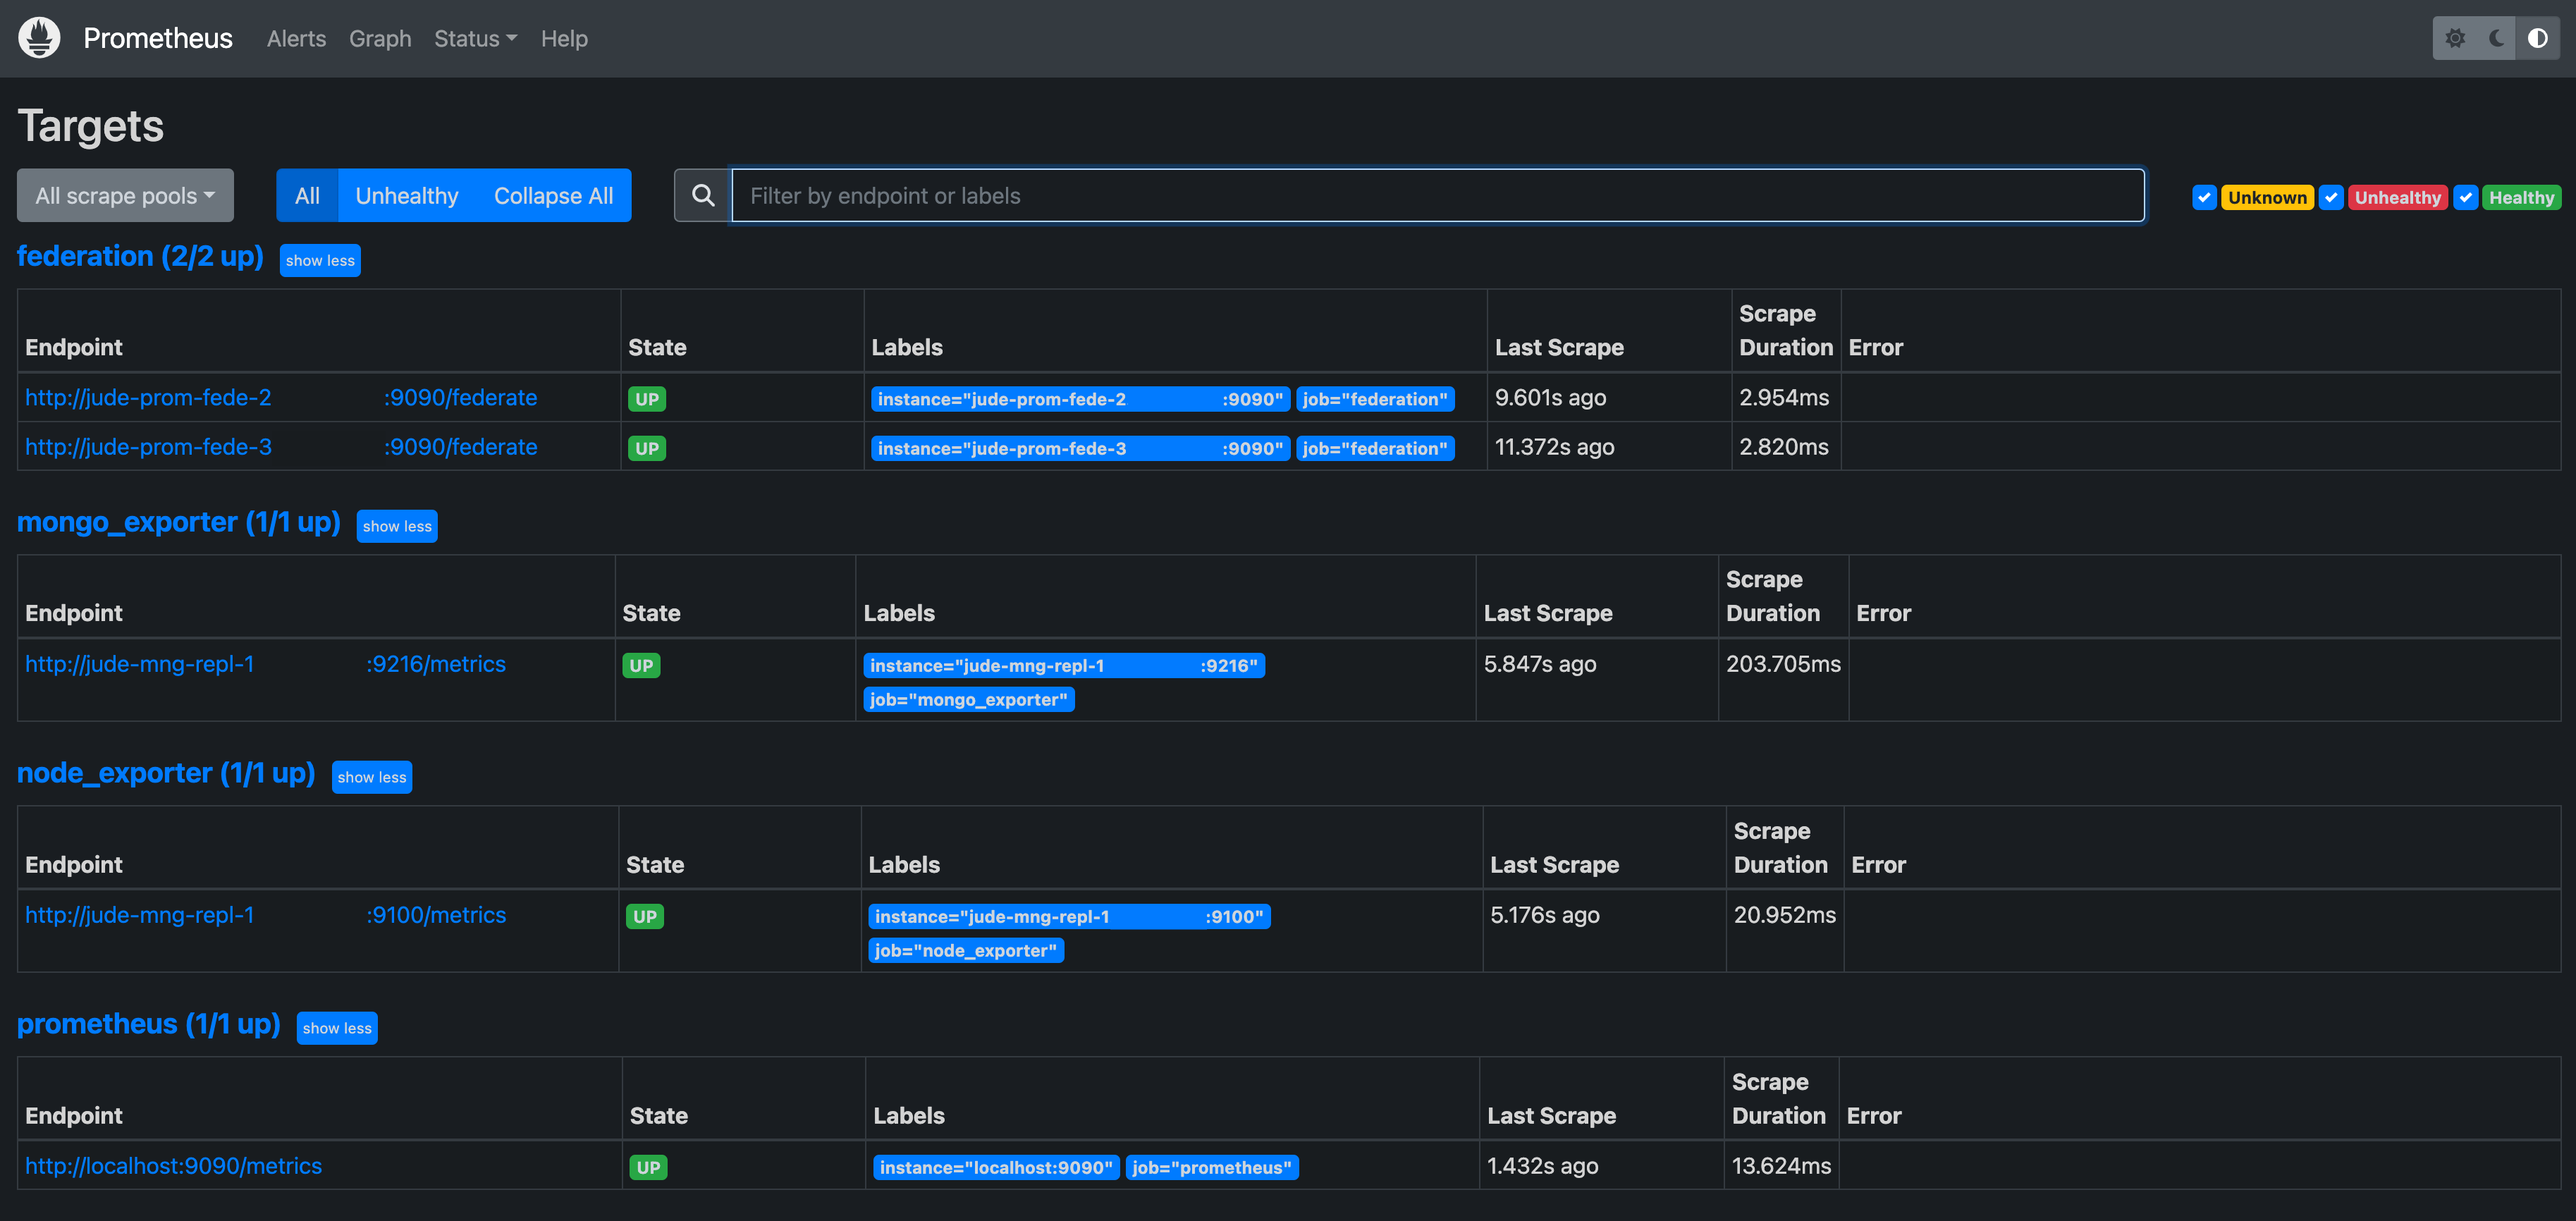
/federate 엔드포인트를 확인합니다.
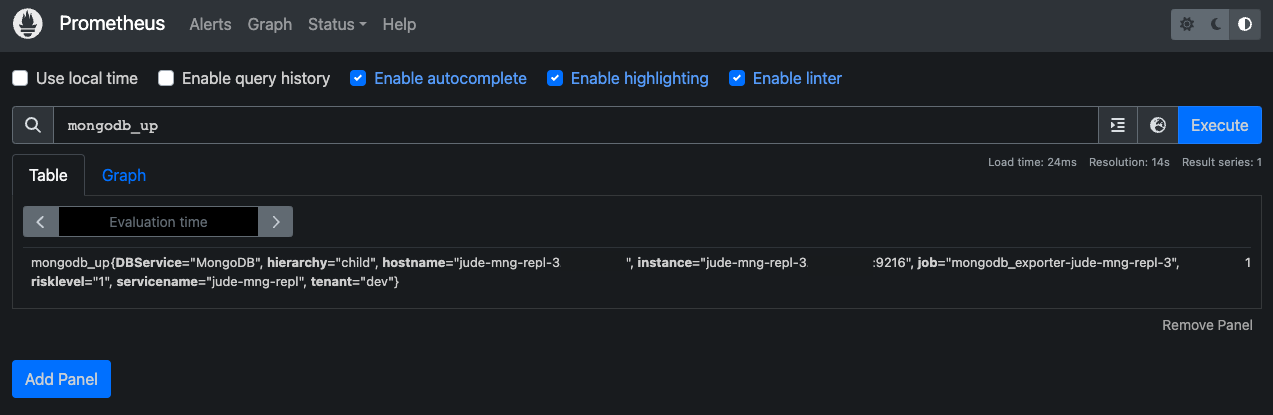
children Prometheus(prom-fede-2, prom-fede-3)가 federate 된 것을 확인할 수 있습니다.


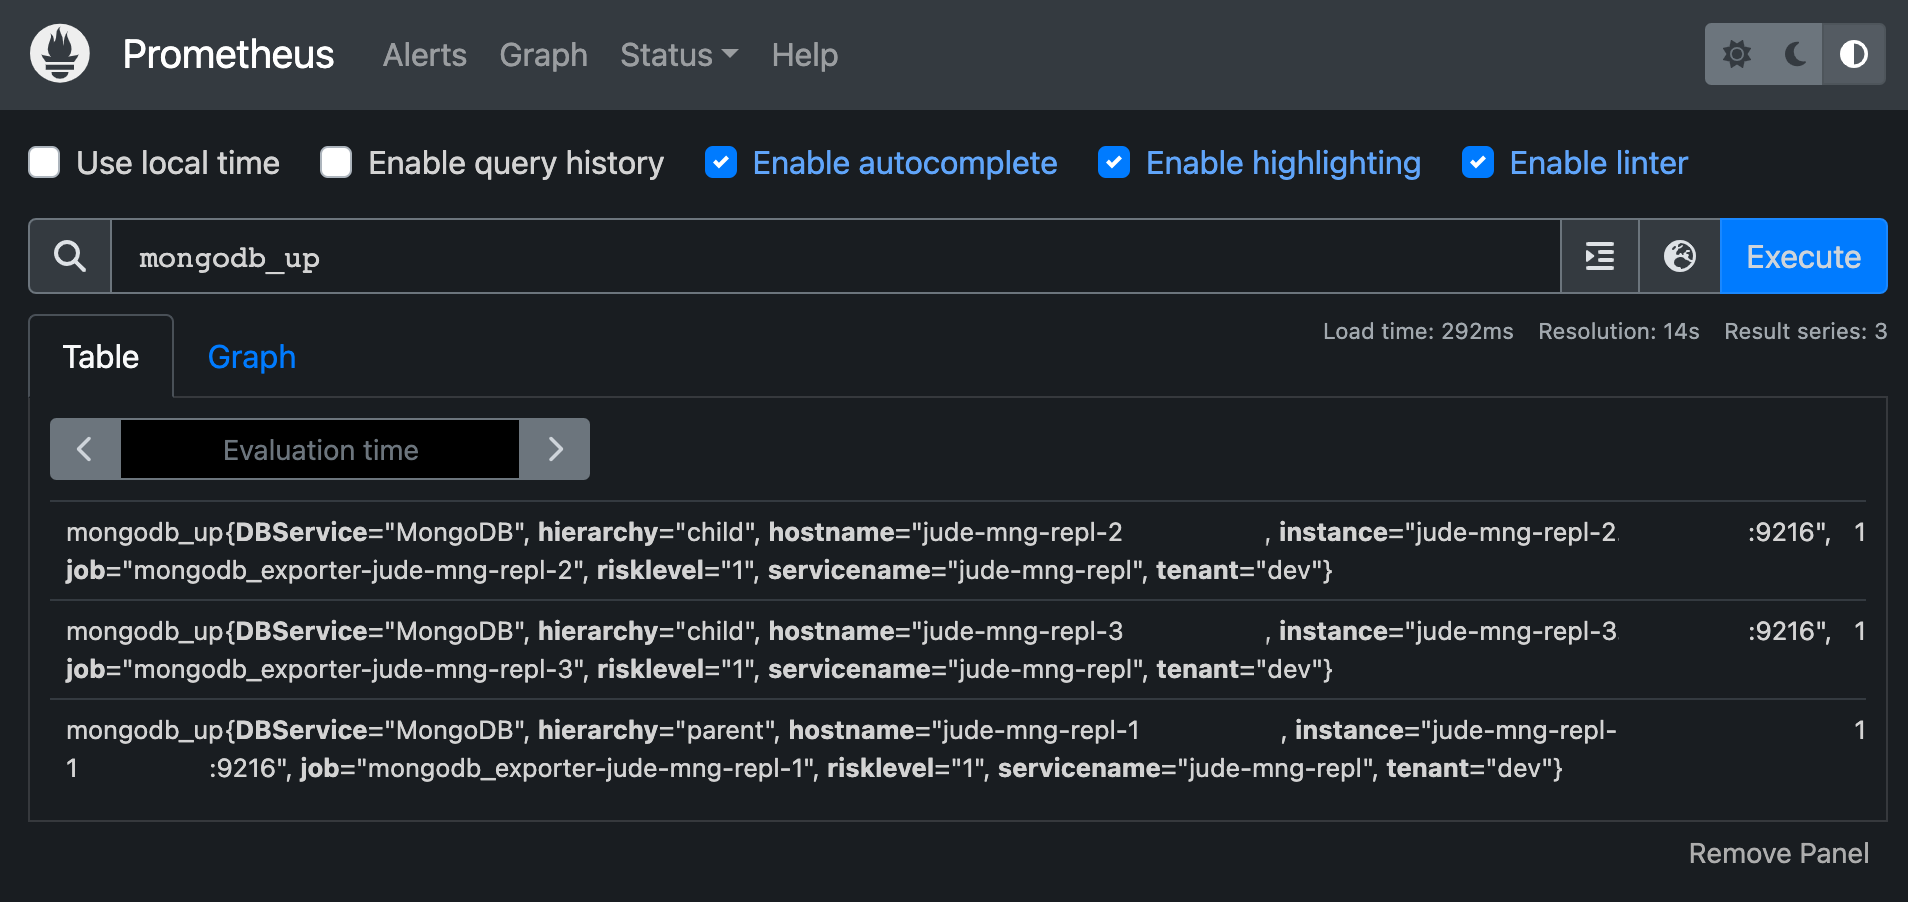
parent 프로메테우스 서버에서 child 프로메테우스 서버 metric을 조회할 수 있습니다.
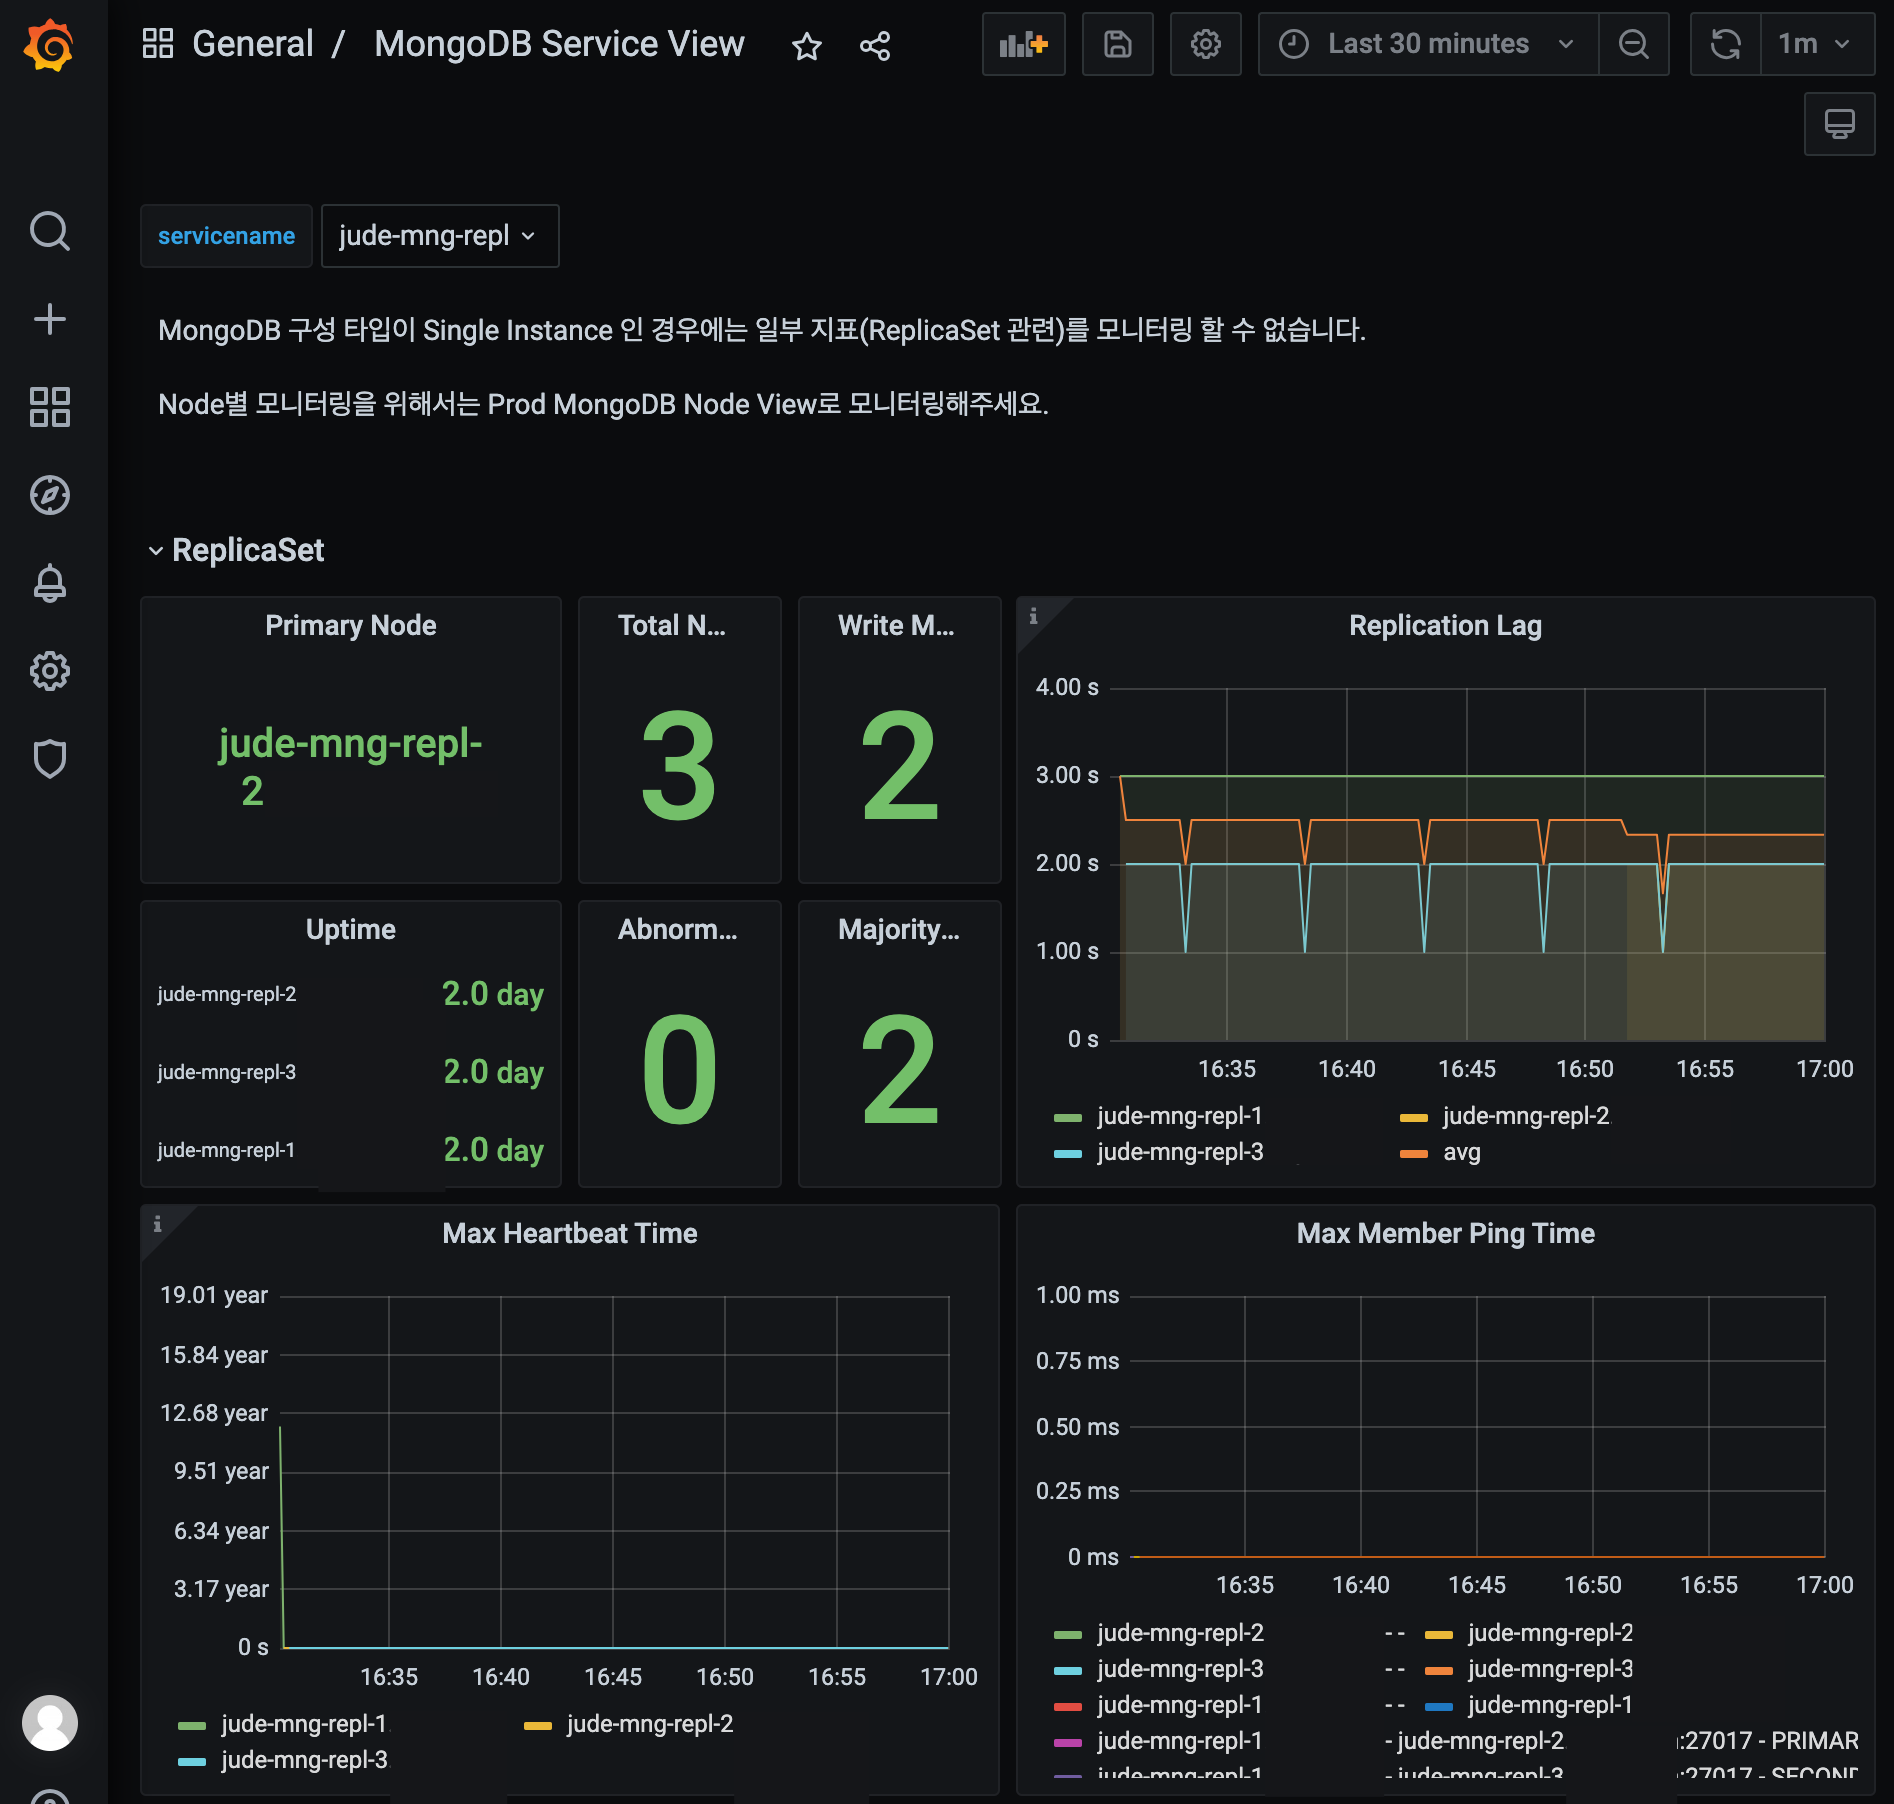
parent 프로메테우스를 관측하는 그라파나 대쉬보드에서, child 프로메테우스의 메트릭 시각화가 이루어지는 것을 확인할 수 있습니다.
Prometheus node 2 (Child Prometheus)
Child Prometheus 서버를 확인합니다.
Child Prometheus인 prometheus 2 서버에서는, 해당 서버가 observe 하는 타겟(mng-repl-2)의 메트릭만 확인할 수 있습니다.
Prometheus node 3 (Child Prometheus)
또 다른 Child Prometheus 서버, prometheus 3를 확인합니다.
Child Prometheus인 prometheus 3 서버 또한 해당 서버가 observe 하는 타겟(mng-repl-3)의 메트릭만 확인할 수 있습니다.

결과적으로 프로메테우스 클러스터는 MongoDB replica set을 위와 같은 형태로 관측합니다.
결론
Prometheus Federation을 통해 Prometheus 메트릭 저장소의 샤딩을 구성했습니다.
Child Prometheus를 federate한 Parent Prometheus 서버를 통해 분산된 메트릭을 관측할 수 있습니다.
REFERENCE
https://prometheus.io/docs/prometheus/latest/federation/
Federation | 토리맘의 한글라이즈 프로젝트
Federating Prometheus Effectively | by Hayk Davtyan | Level Up Coding
Horizontally Scaling Prometheus at Wish | by Tom Wiedenbein | Wish Engineering And Data Science | Medium